
Drive-Thru Queue Health
Analyze quick service restaurant drive-thru camera images and return structured queue health details, including cars waiting, estimated wait time, queue overflow, bottleneck location, and apparent peak traffic period.
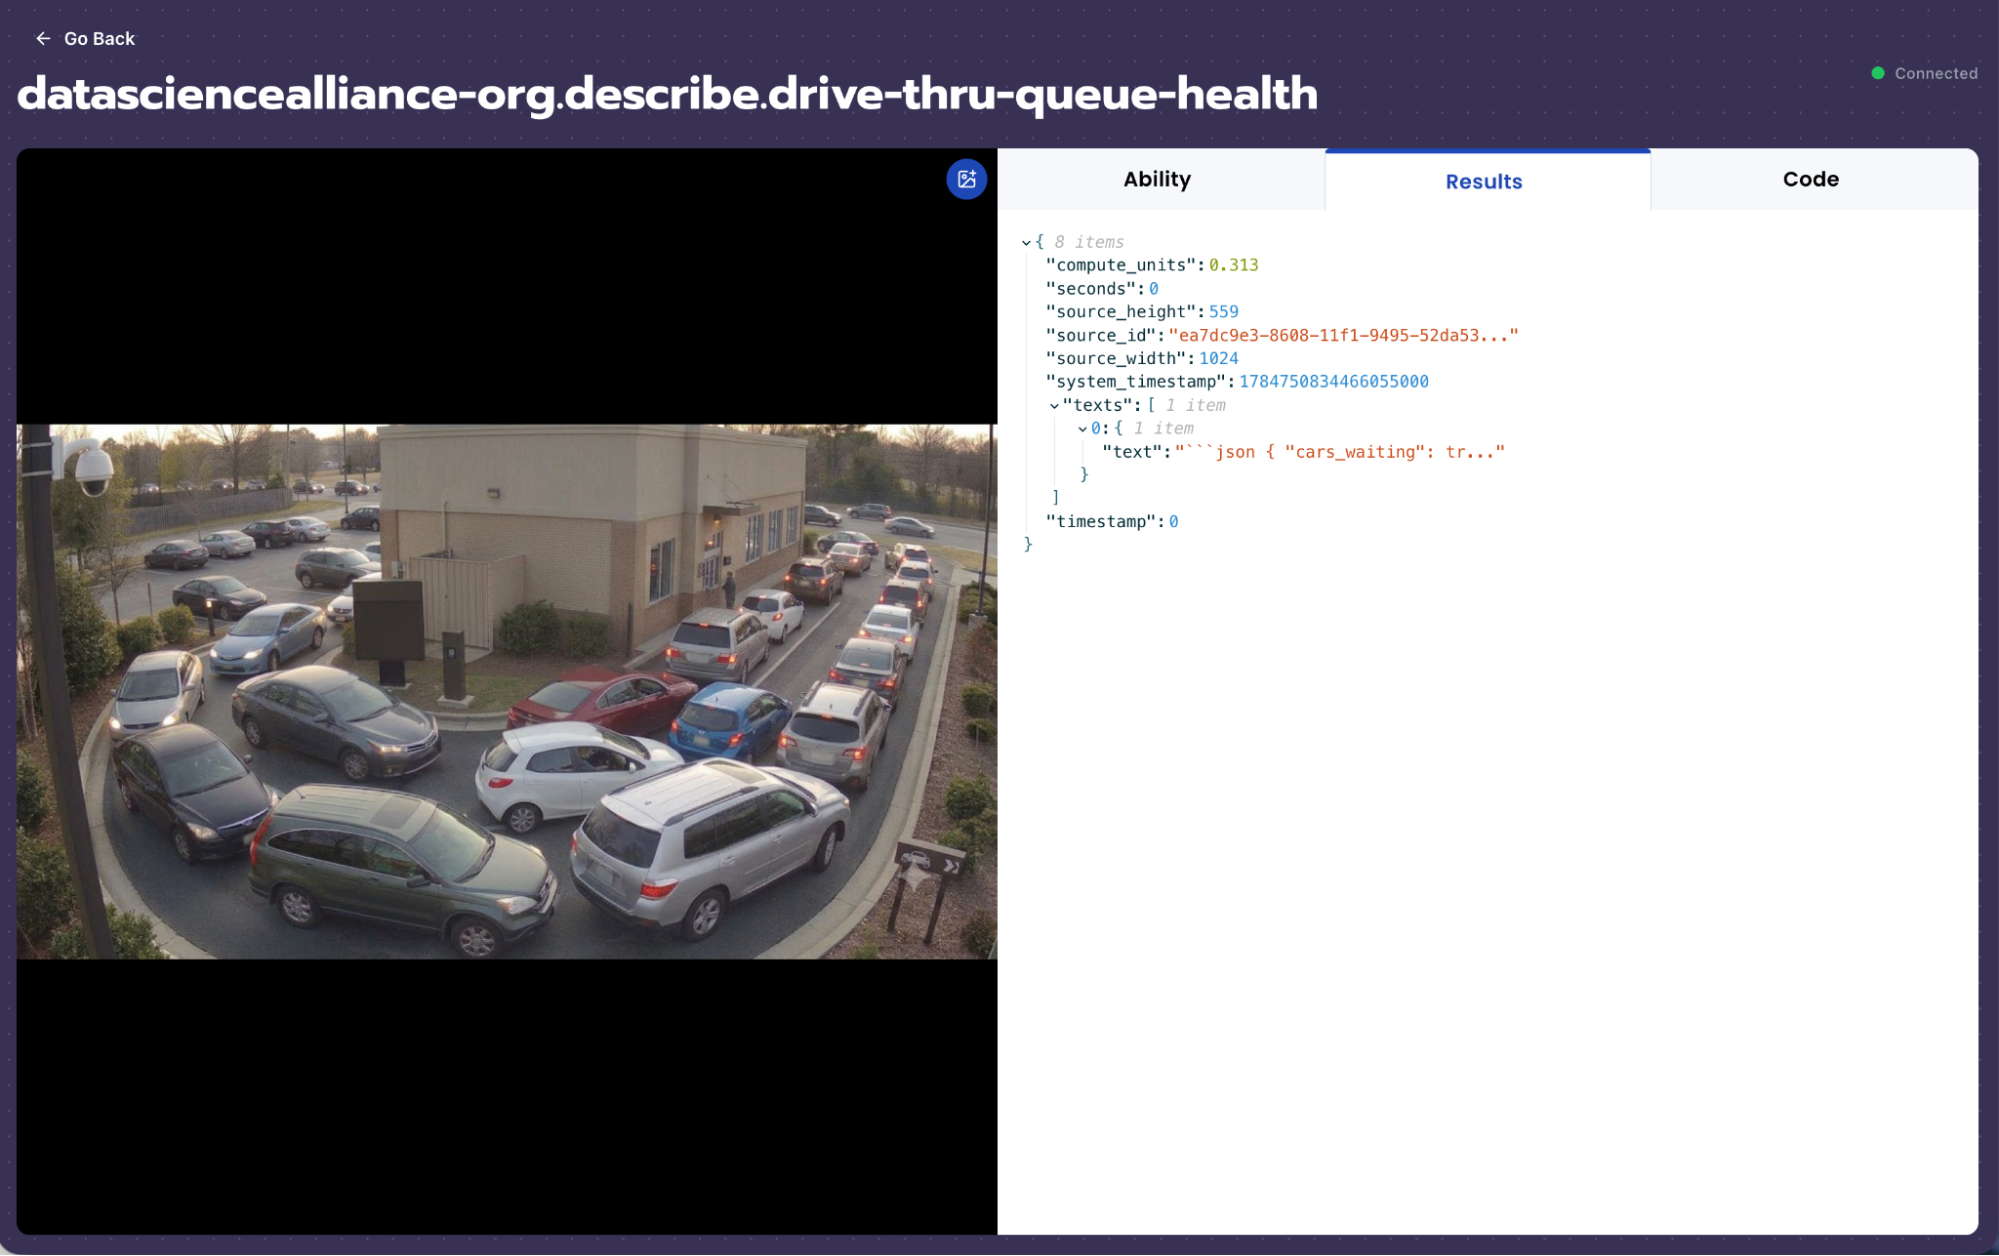
datasciencealliance-org.describe.drive-thru-queue-health:latest
Prompt
Analyze the quick service restaurant drive-thru image and return structured queue health information.
Return only valid JSON. Do not include markdown, explanations, or extra commentary.
Use this exact JSON structure:
{
"cars_waiting": null,
"car_count": null,
"estimated_wait_time": null,
"queue_extending_beyond_expected_area": null,
"overflow_location": null,
"bottleneck_location":
...Run the full prompt in your EyePop.ai dashboard
Input
Image
Output
Structured JSON queue health report with cars_waiting, car_count, estimated_wait_time, queue_extending_beyond_expected_area, overflow_location, bottleneck_location, peak_traffic_period, and visual_evidence
Image size
640x640
Model type
EyePop.ai VLM

How It Works
Problem Description
Quick service restaurants need to monitor drive-thru queue health because long waits, queue overflow, and service bottlenecks can slow operations and create poor customer experiences. A drive-thru line that stays inside the expected lane may be manageable, but a queue that extends into the parking lot, blocks parking spaces, reaches the driveway entrance, or spills toward the street can create larger safety and traffic issues.
Manually reviewing drive-thru camera images is difficult to scale across different locations and time periods. This ability uses a Describe Image task to analyze a drive-thru camera image and return structured queue health information, including whether cars are waiting, how many cars are in the queue, the estimated wait time, whether the queue extends beyond the expected area, where the overflow is located, the visible bottleneck location, and the apparent peak traffic period.
The expected input is an outdoor drive-thru camera image showing a quick service restaurant exterior, drive-thru lane, parking lot, driveway entrance, or nearby street access. The expected output is a structured JSON object describing the drive-thru queue condition.
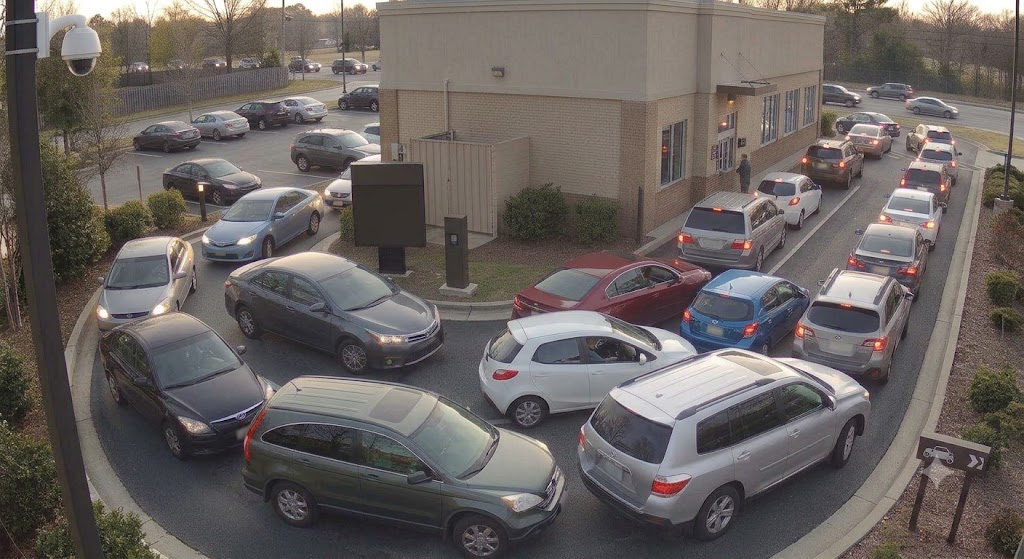
This ability is useful for identifying whether the drive-thru is operating normally, whether the queue is getting too long, whether cars are spilling into areas they should not be, and where the main bottleneck appears to be. For example, a short queue of two or three cars should return a low estimated wait time with no overflow. A long queue wrapped around the restaurant and extending into the parking lot should return a high or very high estimated wait time with queue overflow. A backup near the order speaker, payment window, pickup window, or drive-thru entrance should identify that location as the bottleneck.
UI Tutorial
Step 1: Create a Describe Image Ability
Go to the Abilities tab and select Create Ability. Fill out the basic information for the ability.
Then click Continue.
Step 2: Task Configuration
Select or create a dataset containing drive-thru camera images. The dataset should include a variety of clear drive-thru conditions, such as short healthy queues, long contained queues, queue overflow into the parking lot, queue overflow toward the street, order speaker bottlenecks, payment window bottlenecks, pickup window bottlenecks, entrance merge bottlenecks, breakfast rush, lunch rush, dinner rush, and off-peak calm periods. Because this is a Describe Image ability, you do not need classification labels. The ability will return a structured JSON output instead of a single class label.
Step 3: Configuration
Use Max New Tokens = 300 because the model needs enough space to return the full JSON object with multiple fields. Use Medium - 640x640 because the model needs enough visual detail to count cars, see where the drive-thru lane is, identify overflow, and locate the bottleneck. FPS is not applicable because this is an image description ability, not a video event detection ability.
Step 4: Prompt
Paste the prompt above into the prompt box
Step 5: Create Ability
Click Create Ability. The final alias should look like this: datasciencealliance-org.describe.drive-thru-queue-health:latest
Step 6: Test the Ability
Test the ability with one clear drive-thru image first. A strong test image should clearly show the drive-thru lane, the cars in the queue, the restaurant building, the parking lot, and whether the queue is contained or overflowing.
A good output for a long overflow queue might look like this:
{
"cars_waiting": true,
"car_count": 12,
"estimated_wait_time": "high",
"queue_extending_beyond_expected_area": true,
"overflow_location": "parking_lot_aisle",
"bottleneck_location": "overall_queue",
"peak_traffic_period": "lunch_rush",
"visual_evidence": "A long line of cars wraps around the restaurant and extends into the parking lot aisle during bright midday conditions."
}
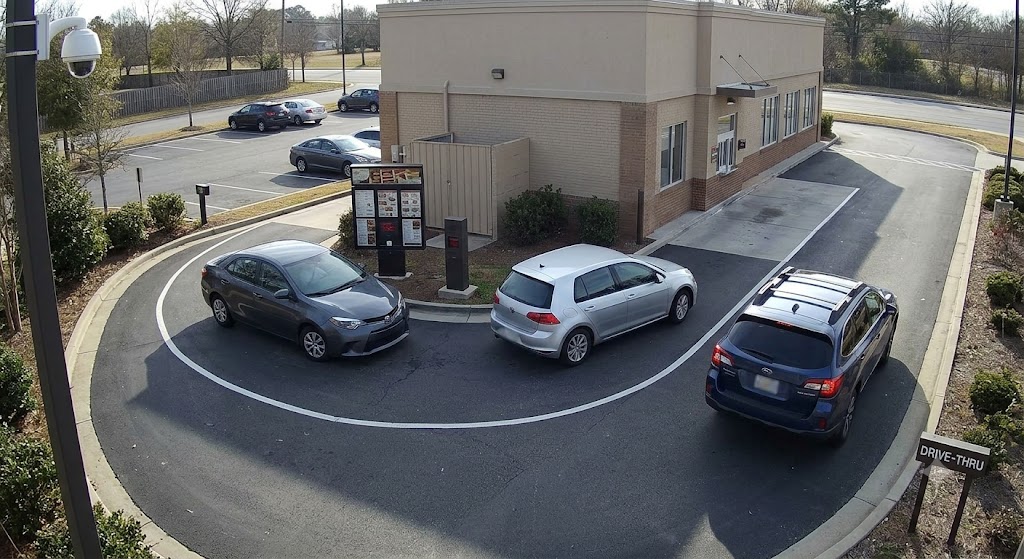
A good output for a calm off-peak image might look like this:
{
"cars_waiting": true,
"car_count": 2,
"estimated_wait_time": "low",
"queue_extending_beyond_expected_area": false,
"overflow_location": "none",
"bottleneck_location": "none",
"peak_traffic_period": "off_peak",
"visual_evidence": "Only two cars are visible in the drive-thru lane and the surrounding parking lot aisles remain clear."
}
Get early access
Want to move faster with visual automation? Request early access to Abilities and get notified as new vision capabilities roll out.